Note
Go to the end to download the full example code.
1. Visualize a Single Curvelet#
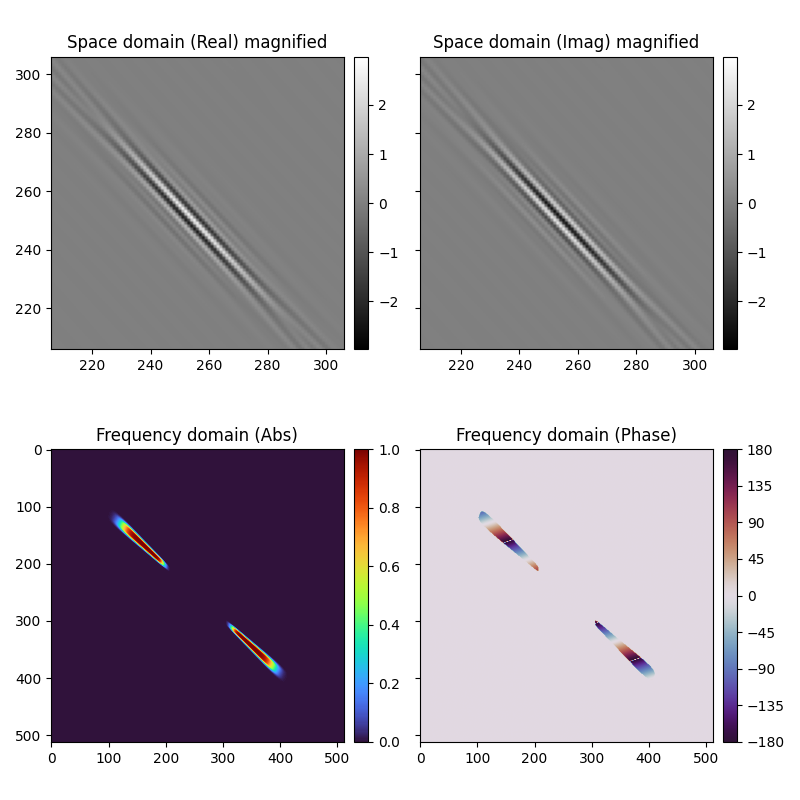
This example shows a single curvelet coefficient in spatial and frequency domains.
import matplotlib.pyplot as plt
import numpy as np
from matplotlib.ticker import MultipleLocator

from curvelops import FDCT2D
from curvelops.plot import create_colorbar
Setup#
Curvelet Domain#
Select single curvelet#
Perform adjoint transform and reshape#
F-K domain#
x_fk = np.fft.fftshift(np.fft.fft2(np.fft.ifftshift(x), norm="ortho"))
Visualize#
vmin, vmax = 0.8 * np.array([-1, 1]) * np.abs(np.max(x))
fig, ax = plt.subplots(2, 2, figsize=(8, 8), sharex="row", sharey="row")

im = ax[0, 0].imshow(x.real.T, cmap="gray", vmin=vmin, vmax=vmax)
create_colorbar(im, ax[0, 0])

im = ax[0, 1].imshow(x.imag.T, cmap="gray", vmin=vmin, vmax=vmax)
create_colorbar(im, ax[0, 1])

im = ax[1, 0].imshow(np.abs(x_fk).T, cmap="turbo", vmin=0)
create_colorbar(im, ax[1, 0])

mask = np.abs(x_fk) > 0.01 * np.abs(x_fk).max()
im = ax[1, 1].imshow(
    (mask * np.angle(x_fk, deg=True)).T,
    cmap="twilight_shifted",
    vmin=-180,
    vmax=180,
)
cax, cb = create_colorbar(im, ax[1, 1])
cax.get_yaxis().set_major_locator(MultipleLocator(45))


ax[0, 0].set(
    xlim=(m // 2 - 50, m // 2 + 50),
    ylim=(n // 2 - 50, n // 2 + 50),
    title="Space domain (Real) magnified",
)
ax[0, 1].set(title="Space domain (Imag) magnified")
ax[1, 0].set(title="Frequency domain (Abs)")
ax[1, 1].set(title="Frequency domain (Phase)")
fig.tight_layout()

Total running time of the script: (0 minutes 1.631 seconds)