Note
Go to the end to download the full example code.
2. Sigmoid Example#
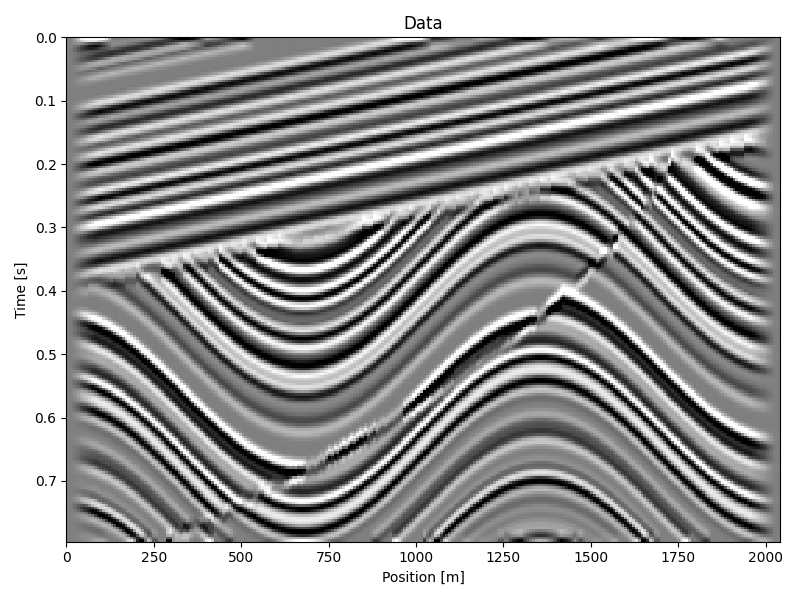
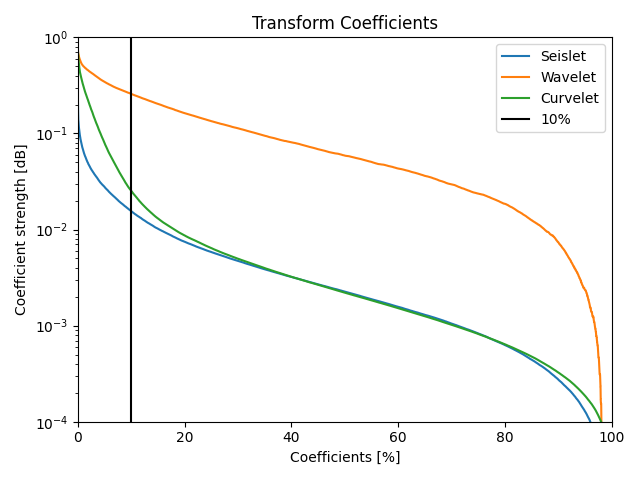
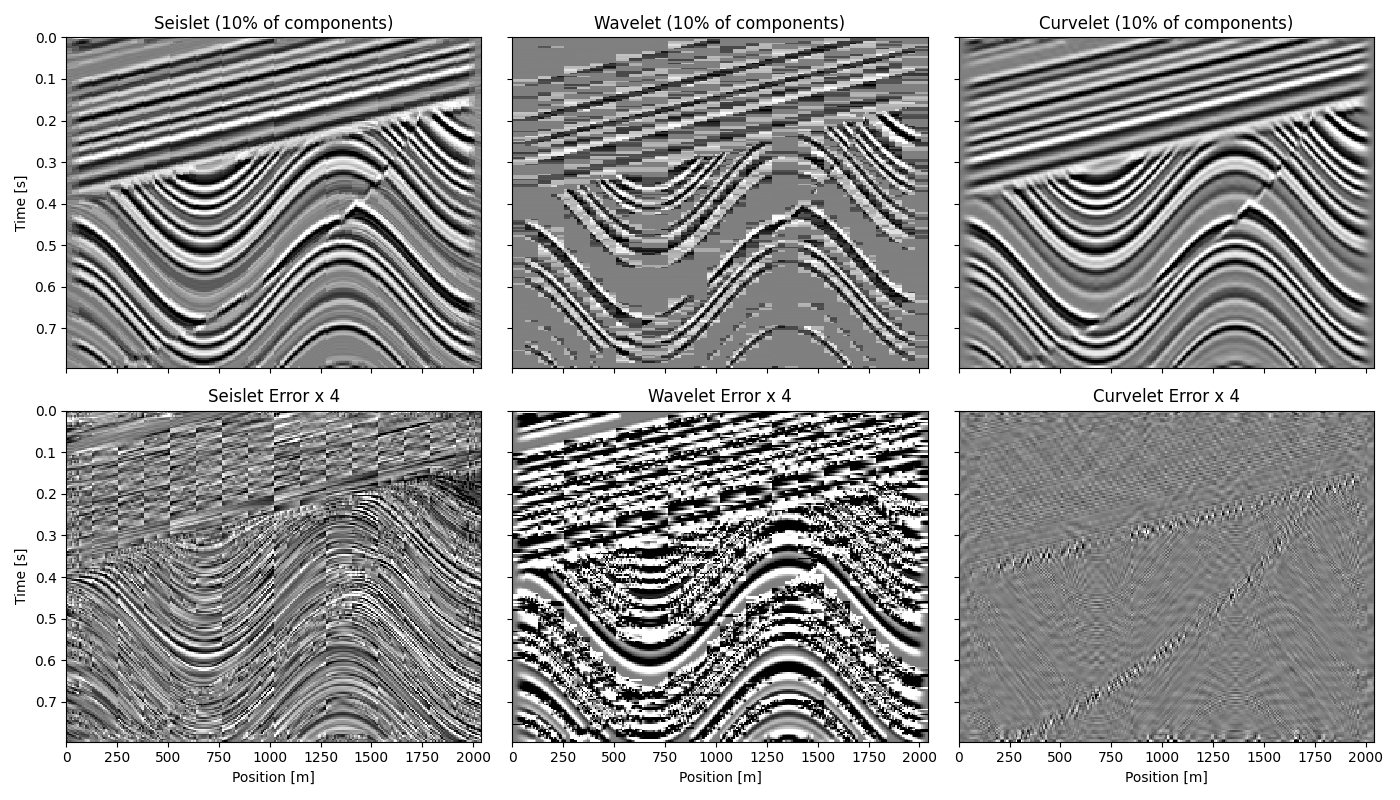
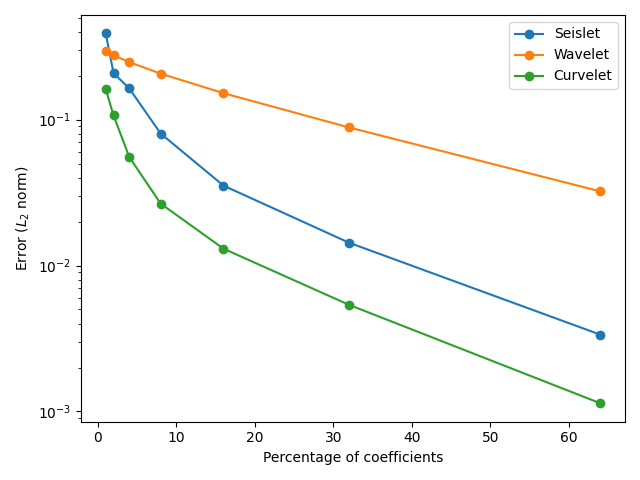
This example shows the effectiveness of curvelets in describing a typical subsurface structure. It compares the Curvelet transform with the Wavelet and Seislet transforms.
# sphinx_gallery_thumbnail_number = 3
Try out tqdm for progress bars!
Input data#
clip = 0.5 * np.max(np.abs(d))
opts = dict(
    aspect="auto",
    extent=(x[0], x[-1], t[-1], t[0]),
    vmin=-clip,
    vmax=clip,
    cmap="gray",
    interpolation="nearest",
)

fig, ax = plt.subplots(figsize=(8, 6), sharey=True, sharex=True)
ax.imshow(d.T, **opts)
ax.set(xlabel="Position [m]", ylabel="Time [s]", title="Data")
fig.tight_layout()

Sparsifying Transforms#
Seislet
Wavelet
Curvelet
(51200, 51200)
# Wavelet
Wop = pylops.signalprocessing.Seislet(np.zeros_like(slope.T), sampling=(dx, dt))
Wop.shape
(51200, 51200)
(387589, 51200)
def reconstruct(data, op, perc=0.1):
    """
    Convenience function to calculate reconstruction using top
    `perc` percent of coefficients of a given operator `op`.
    """
    y = op * data.ravel()
    denoise = np.zeros_like(y)

    # Order coefficients by strength
    strong_idx = np.argsort(-np.abs(y))
    strong = np.abs(y)[strong_idx]

    # Select only top `perc`% coefficients
    strong_idx = strong_idx[: int(np.rint(len(strong_idx) * perc))]
    denoise[strong_idx] = y[strong_idx]

    data_denoise = op.inverse(denoise).reshape(data.shape)
    return data_denoise.real, strong
fig, ax = plt.subplots()
ax.semilogy(
    np.linspace(0, 100, len(seis_strong), endpoint=True),
    seis_strong / seis_strong[0],
    label="Seislet",
)
ax.semilogy(
    np.linspace(0, 100, len(dwt_strong), endpoint=True),
    dwt_strong / dwt_strong[0],
    label="Wavelet",
)
ax.semilogy(
    np.linspace(0, 100, len(dct_strong), endpoint=True),
    dct_strong / dct_strong[0],
    label="Curvelet",
)
ax.set(
    xlim=(0, 100),
    ylim=(1e-4, 1),
    xlabel="Coefficients [%]",
    ylabel="Coefficient strength [dB]",
    title="Transform Coefficients",
)
ax.axvline(100 * perc, color="k", label=f"{100*perc:.0f}%")
ax.legend()
fig.tight_layout()

gain = 4
fig, ax = plt.subplots(2, 3, figsize=(14, 8), sharey=True, sharex=True)
for i, (d_trans, title) in enumerate(
    zip([d_seis, d_dwt, d_dct], ["Seislet", "Wavelet", "Curvelet"])
):
    ax[0, i].imshow(d_trans.T, **opts)
    im = ax[1, i].imshow((d - d_trans).T, **opts)
    im.set_clim(vmin=-clip / gain, vmax=clip / gain)
    ax[0, i].set(title=f"{title} ({100*perc:.0f}% of components)")
    ax[1, i].set(title=f"{title} Error x {gain}", xlabel="Position [m]")
ax[0, 0].set(ylabel="Time [s]")
ax[1, 0].set(ylabel="Time [s]")
fig.tight_layout()

# Calculate error in reconstruction by number of coefficients used
error_seis = []
error_dwt = []
error_dct = []
for perc in tqdm(2 ** np.arange(7) / 100.0):
    d_seis = reconstruct(d, Sop, perc=perc)[0]
    d_dwt = reconstruct(d, Wop, perc=perc)[0]
    d_dct = reconstruct(d, Cop, perc=perc)[0]
    error_seis.append(np.linalg.norm(d_seis - d))
    error_dwt.append(np.linalg.norm(d_dwt - d))
    error_dct.append(np.linalg.norm(d_dct - d))
fig, ax = plt.subplots()
ax.semilogy(2 ** np.arange(7), error_seis, "o-", label="Seislet")
ax.semilogy(2 ** np.arange(7), error_dwt, "o-", label="Wavelet")
ax.semilogy(2 ** np.arange(7), error_dct, "o-", label="Curvelet")
ax.set(xlabel="Percentage of coefficients", ylabel=r"Error ($L_2$ norm)")
ax.legend()
fig.tight_layout()

Total running time of the script: (0 minutes 45.103 seconds)