Note
Go to the end to download the full example code.
5. Seismic Regularization#
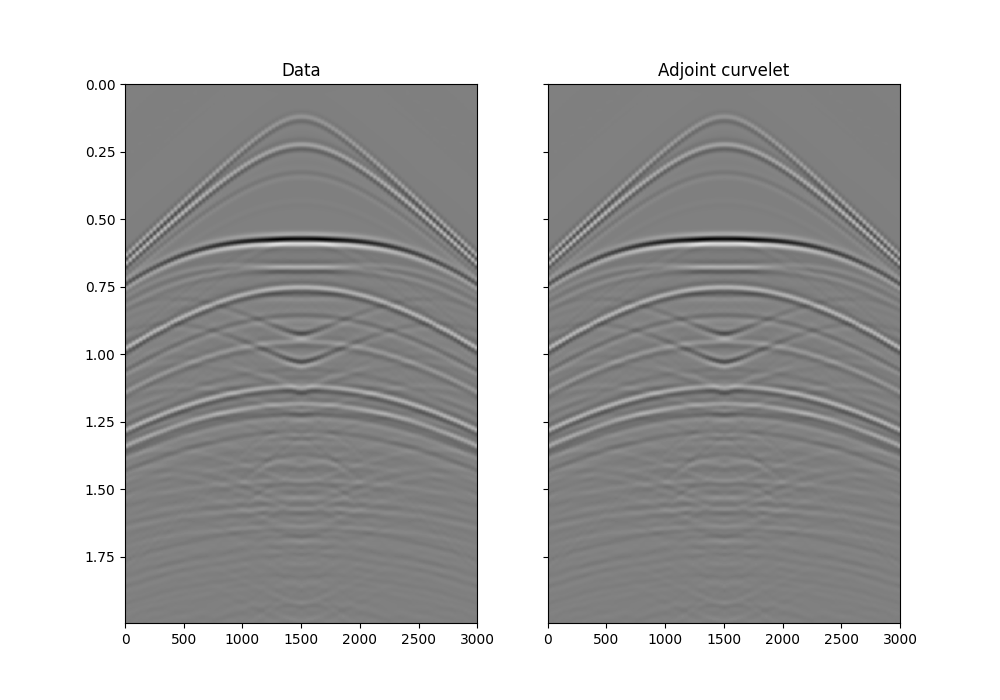
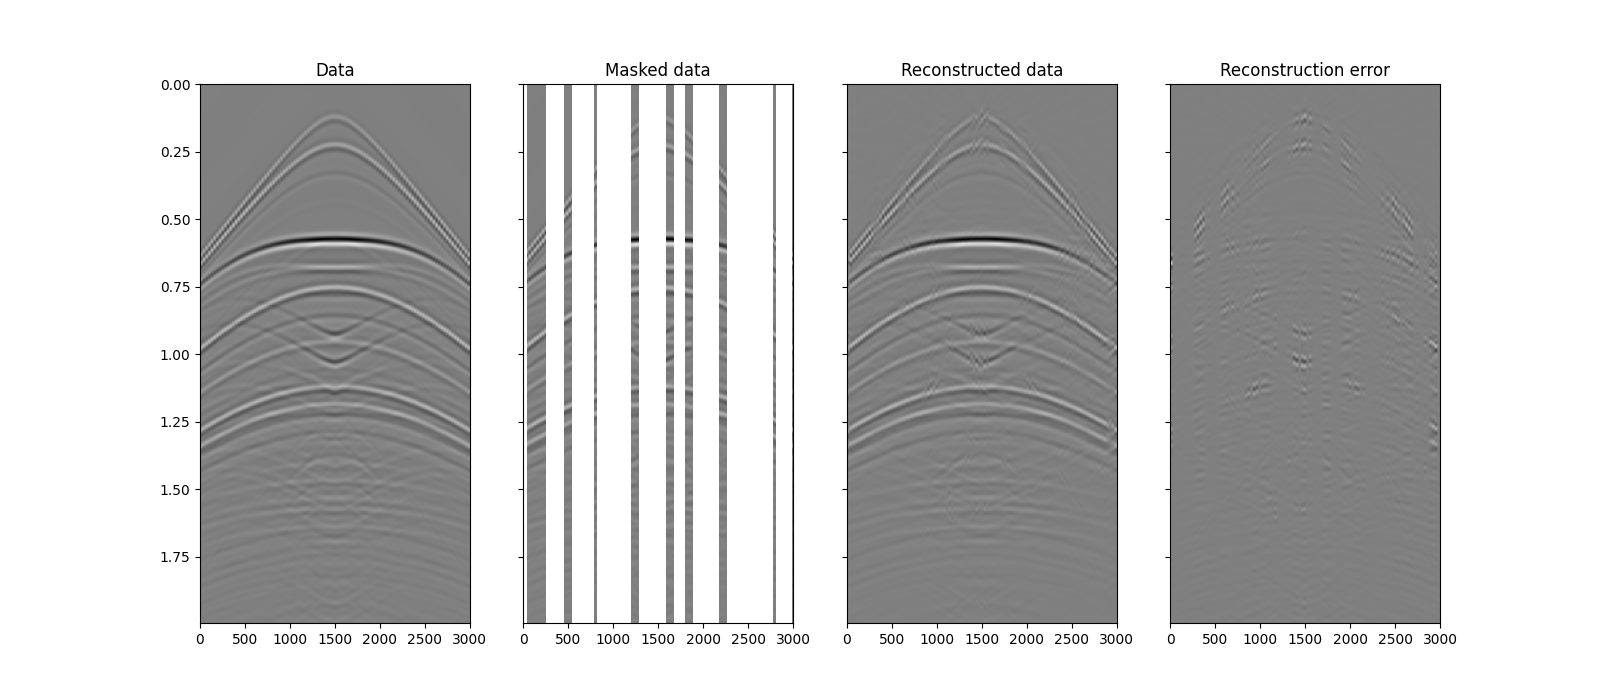
This example shows how to use the Curvelet transform to condition a missing-data seismic regularization problem.
# sphinx_gallery_thumbnail_number = 2
import warnings

warnings.filterwarnings("ignore")

import matplotlib.pyplot as plt
import numpy as np
import pylops
from pylops.optimization.sparsity import fista
from scipy.signal import convolve

from curvelops import FDCT2D

np.random.seed(0)
warnings.filterwarnings("ignore")
Setup#
inputfile = "../testdata/seismic.npz"
inputdata = np.load(inputfile)

x = inputdata["R"][50, :, ::2]
x = x / np.abs(x).max()
taxis, xaxis = inputdata["t"][::2], inputdata["r"][0]

par = {}
par["nx"], par["nt"] = x.shape
par["dx"] = inputdata["r"][0, 1] - inputdata["r"][0, 0]
par["dt"] = inputdata["t"][1] - inputdata["t"][0]

# Add wavelet
wav = inputdata["wav"][::2]
wav_c = np.argmax(wav)
x = np.apply_along_axis(convolve, 1, x, wav, mode="full")
x = x[:, wav_c:][:, : par["nt"]]

# Gain
gain = np.tile((taxis**2)[:, np.newaxis], (1, par["nx"])).T
x *= gain

# Subsampling locations
perc_subsampling = 0.5
Nsub = int(np.round(par["nx"] * perc_subsampling))
iava = np.sort(np.random.permutation(np.arange(par["nx"]))[:Nsub])

# Restriction operator
Rop = pylops.Restriction((par["nx"], par["nt"]), iava, axis=0, dtype="float64")

y = Rop @ x
xadj = Rop.H @ y

# Apply mask
ymask = Rop.mask(x)
Curvelet transform#
opts_plot = dict(
    cmap="gray",
    vmin=-0.1,
    vmax=0.1,
    extent=(xaxis[0], xaxis[-1], taxis[-1], taxis[0]),
)

fig, axs = plt.subplots(1, 2, sharey=True, figsize=(10, 7))
axs[0].imshow(x.T, **opts_plot)
axs[0].set_title("Data")
axs[0].axis("tight")
axs[1].imshow(np.real(xcadj).T, **opts_plot)
axs[1].set_title("Adjoint curvelet")
axs[1].axis("tight")

(0.0, 3000.0, 1.995, 0.0)
Reconstruction based on Curvelet transform#
Combined modelling operator
FISTA (soft thresholding)
--------------------------------------------------------------------------------
The Operator Op has 20000 rows and 305683 cols
eps = 1.000000e-03      tol = 1.000000e-10      niter = 100
alpha = 1.000000e+00    thresh = 5.000000e-04
--------------------------------------------------------------------------------
   Itn          x[0]              r2norm     r12norm     xupdate
     1   -7.50e-04+7.58e-19j    1.067e-02   2.690e-01   1.383e+00
     2   -9.12e-04+5.16e-19j    9.923e-03   2.541e-01   8.676e-02
     3   -1.04e-03+1.27e-19j    9.270e-03   2.408e-01   9.289e-02
     4   -1.17e-03-1.43e-19j    8.703e-03   2.293e-01   9.611e-02
     5   -1.24e-03-1.52e-19j    8.240e-03   2.191e-01   9.767e-02
     6   -1.25e-03-1.53e-19j    7.846e-03   2.104e-01   9.769e-02
     7   -1.24e-03-1.52e-19j    7.534e-03   2.028e-01   9.678e-02
     8   -1.23e-03-1.50e-19j    7.286e-03   1.963e-01   9.516e-02
     9   -1.21e-03-1.49e-19j    7.091e-03   1.906e-01   9.344e-02
    10   -1.21e-03-1.48e-19j    6.910e-03   1.856e-01   9.125e-02
    11   -1.21e-03-1.49e-19j    6.755e-03   1.814e-01   8.857e-02
    21   -1.24e-03-1.52e-19j    6.198e-03   1.592e-01   6.407e-02
    31   -1.06e-03+1.30e-19j    6.083e-03   1.522e-01   4.776e-02
    41   -1.05e-03+1.29e-19j    6.050e-03   1.493e-01   3.752e-02
    51   -1.12e-03+1.37e-19j    6.022e-03   1.478e-01   3.129e-02
    61   -1.06e-03+1.29e-19j    6.033e-03   1.469e-01   2.793e-02
    71   -1.06e-03-1.30e-19j    6.018e-03   1.463e-01   2.484e-02
    81   -1.05e-03-1.29e-19j    6.023e-03   1.459e-01   2.252e-02
    91   -1.04e-03+1.28e-19j    6.031e-03   1.456e-01   1.938e-02
    92   -1.04e-03+1.28e-19j    6.034e-03   1.456e-01   1.921e-02
    93   -1.04e-03+1.28e-19j    6.034e-03   1.456e-01   1.903e-02
    94   -1.04e-03+1.27e-19j    6.033e-03   1.456e-01   1.884e-02
    95   -1.04e-03+1.27e-19j    6.033e-03   1.455e-01   1.867e-02
    96   -1.04e-03+1.27e-19j    6.033e-03   1.455e-01   1.851e-02
    97   -1.04e-03+1.27e-19j    6.033e-03   1.455e-01   1.830e-02
    98   -1.04e-03+1.27e-19j    6.029e-03   1.455e-01   1.802e-02
    99   -1.04e-03+1.27e-19j    6.026e-03   1.455e-01   1.775e-02
   100   -1.03e-03+1.27e-19j    6.024e-03   1.455e-01   1.753e-02

Iterations = 100        Total time (s) = 18.18
--------------------------------------------------------------------------------
fig, axs = plt.subplots(1, 4, sharey=True, figsize=(16, 7))
axs[0].imshow(x.T, **opts_plot)
axs[0].set_title("Data")
axs[0].axis("tight")
axs[1].imshow(ymask.T, **opts_plot)
axs[1].set_title("Masked data")
axs[1].axis("tight")
axs[2].imshow(xl1.T, **opts_plot)
axs[2].set_title("Reconstructed data")
axs[2].axis("tight")
axs[3].imshow((x - xl1).T, **opts_plot)
axs[3].set_title("Reconstruction error")
axs[3].axis("tight")

(0.0, 3000.0, 1.995, 0.0)
fig, ax = plt.subplots(figsize=(16, 2))
ax.plot(range(1, len(cost) + 1), cost, "k")
ax.set(xlim=[1, len(cost)])
fig.suptitle("FISTA convergence")

Text(0.5, 0.98, 'FISTA convergence')
Total running time of the script: (0 minutes 19.310 seconds)